
Description
Purchase offers unlimited access to:
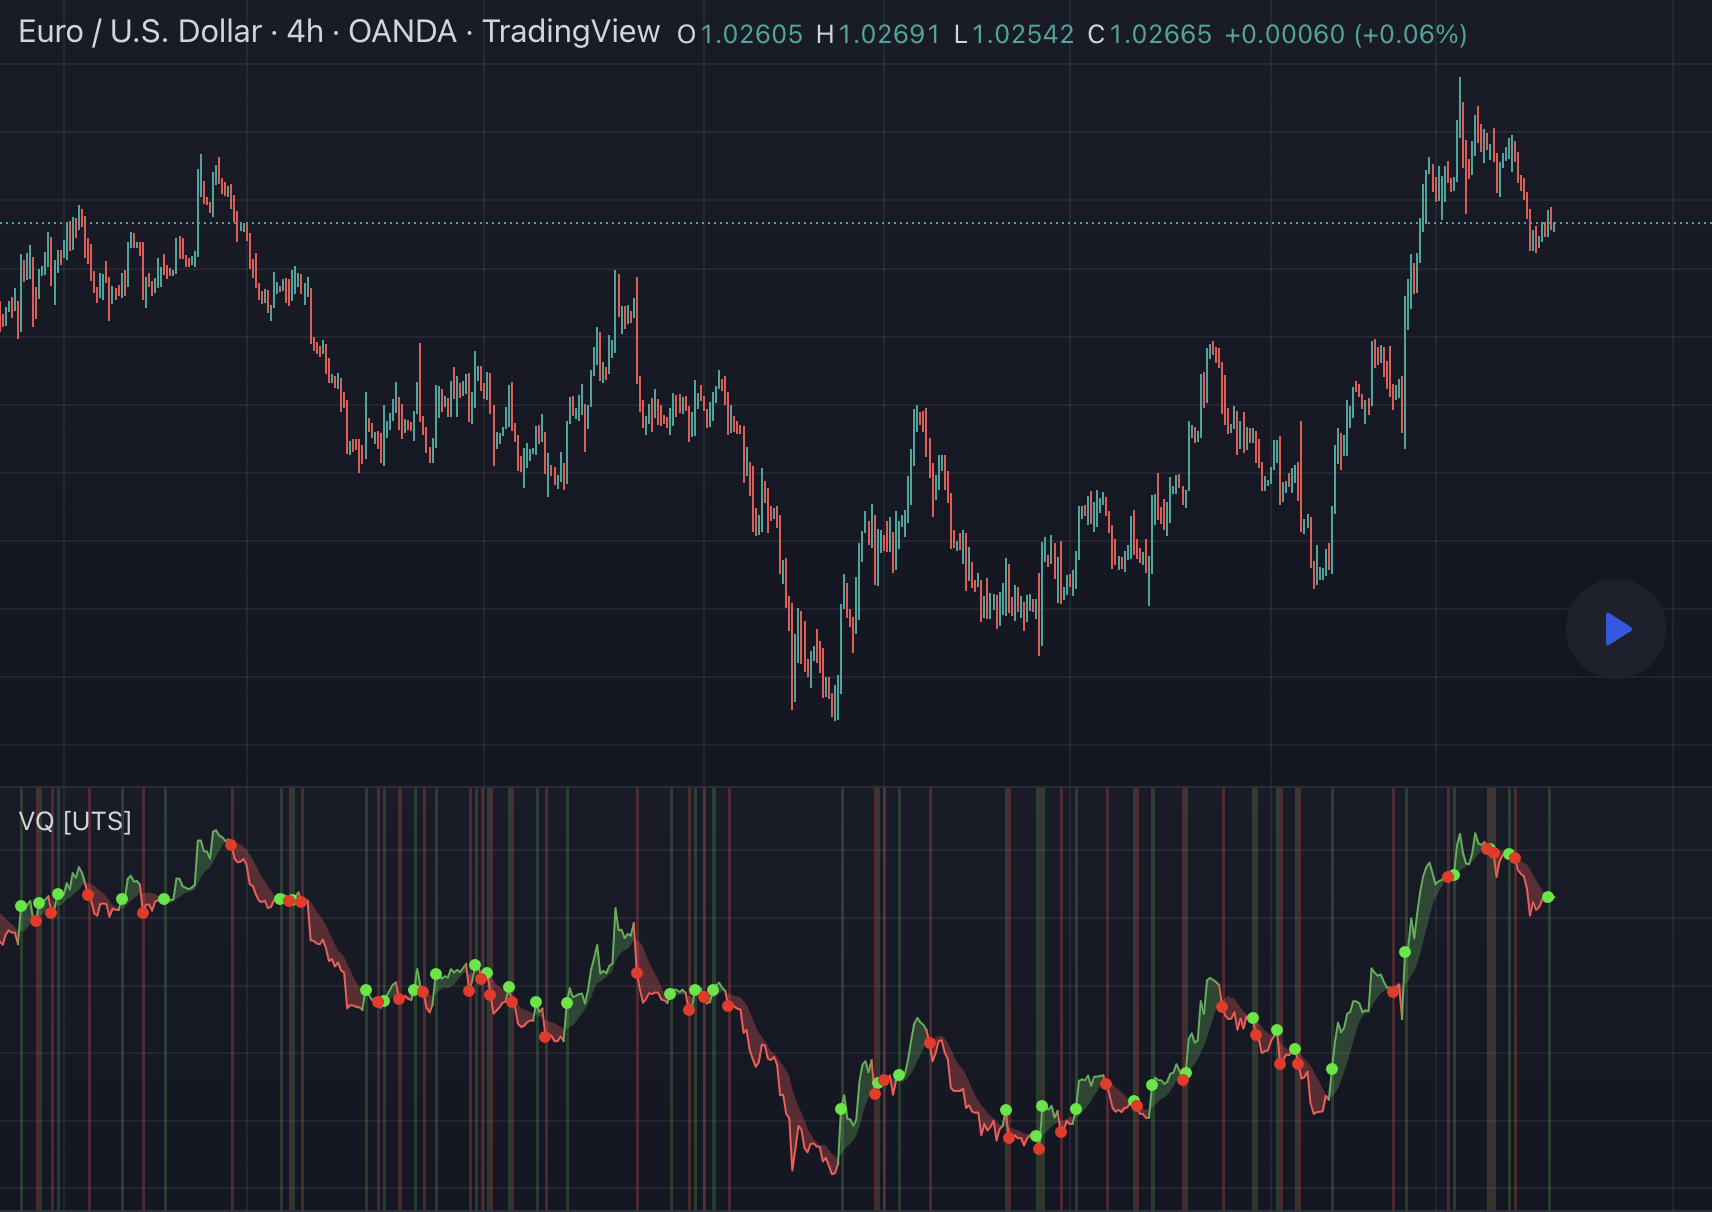
Uber VQ – Volatility Quality Index [UTS]
Name: Uber VQI – Volatility Quality Index
Created: 2022/11/22
Copyright: © UberTradingSystems
Description
The volatility quality index was first introduced by Thomas Stridsman in Technical Analysis of Stocks and Commodities magazine in the August 2002 edition.
This powerful indicator points out the difference between bad and good volatility in order to identify better trade opportunities in the market.
It is suggested to use this indicator as a confirmation signal together with the other indicators in your system.
General Usage
Stridsman suggested buying (or “to go long”) when VQ has increased in the previous 10 bars and selling (or “to go short”) when it has decreased in the previous 10 bars.
This indicator has been updated to reflect its modern iterations. One of the following signals are choosable trading signal generator:
- VQ Sum
- Short MA
- Long MA
All three signal triggering conditions can selectively be drawn on the indicator for study and reference purposes.
In addition, generated buy and sell signals can be drawn on the indicator and are modifiable too.
Alerts
To allow alert notifications, generated signals are connected as selectable “Long Signal” and “Short Signal” to the indicator alerts.
The conditions can be found on the alert sections of the indicator.
In the menu right to the indicator name, press the three dots and select “Add alert on …”.
Under condition options select one of the following:
- Long Signal
- Short Signal
It is advised to select “Once per bar close” as alert execution option.
Moving Averages
To fine-tune the “Short MA” and “Long MA” calculation, 16 different Moving Averages are available to choose from:
- ALMA ( Arnaud Legoux Moving Average)
- DEMA ( Double Exponential Moving Average )
- EMA ( Exponential Moving Average )
- FRAMA ( Fractal Adaptive Moving Average )
- HMA ( Hull Moving Average )
- JURIK (Jurik Moving Average)
- KAMA ( Kaufman Adaptive Moving Average )
- Kijun (Kijun-sen / Tenkan-sen of Ichimoku )
- LSMA (Least Square Moving Average)
- RMA (Running Moving Average)
- SMA ( Simple Moving Average )
- SuperSmoothed (Super Smoothed Moving Average )
- TEMA ( Triple Exponential Moving Average )
- VWMA ( Volume Weighted Moving Average )
- WMA ( Weighted Moving Average )
- ZLEMA (Zero Lag Moving Average)
A freely determinable length allows for sensitivity adjustments that fit your own requirements.
All offered chart overlays, indicators and backtest strategies are written in Pine Script and can be used with TradingView only.
Visit published scripts site for an overview about all public and paid access indicators.
Indicator access is usually given within 1-5 hours after received payment.
Due to the manual aspect of adding users to TradingViews database this process can take up to 24 hours.


![Strategy - Uber STC - Schaff Trend Cycle [UTS]](https://ubertradingsystems.com/wp-content/uploads/2020/08/stc-strategy-250x141.jpg)
Reviews
There are no reviews yet.